
Product managers face a recurring problem: too many candidate features and too little capacity. Prioritizing by gut feel or by who argues loudest produces roadmaps that reflect internal politics rather than economic logic. Sometimes the fundamentals inspire experienced product managers, and for the newly initiated, they set the standard. Three frameworks replace politics with structure: RICE, Weighted Shortest Job First, and opportunity scoring. Each answers a different question, and knowing which question you are asking is the first step toward using the right one.
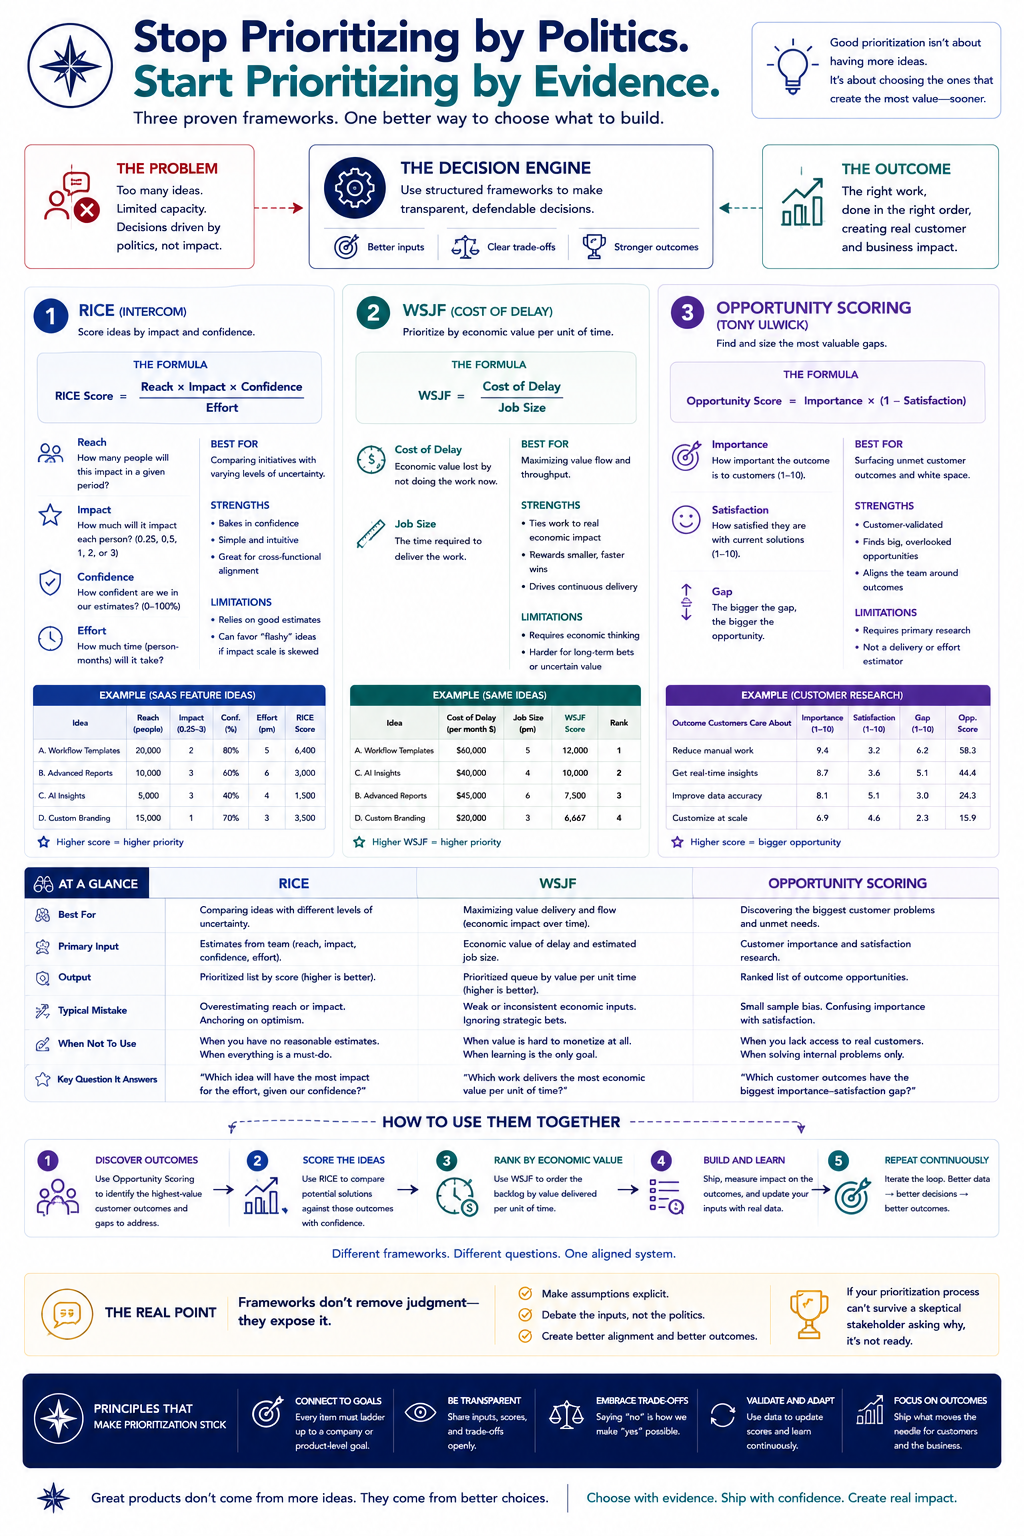
RICE was developed by the messaging software company Intercom to bring consistency to its roadmap decisions. The name stands for reach, impact, confidence, and effort. The formula is reach multiplied by impact, multiplied by confidence, divided by effort. Reach is the number of people a feature will affect in a defined timeframe, such as customers reached per quarter. Impact is scored on a five-tier scale: 3 for massive impact, 2 for high, 1 for medium, 0.5 for low, and 0.25 for minimal. Confidence is expressed as a percentage, typically 100 for high, 80 for medium, and 50 for low, with anything below 50 treated as a moonshot that probably does not belong on the roadmap. Effort is the denominator, estimated in person-months, so a project requiring three person-months scores a 3. The output is a single number that lets a team compare wildly different ideas on the same scale. A feature reaching a thousand users with medium impact and high confidence over two person-months will outscore one reaching five thousand users with massive impact but low confidence over twenty person-months. RICE forces the team to make its assumptions explicit and gives stakeholders a shared language for debating them.
RICE has a clear strength and a clear limit. Its strength is that it bakes confidence into the calculation, penalizing speculative bets and rewarding data-backed ideas. Its limit is that it treats effort as the only cost and ignores the cost of delay. A feature with a high RICE score that takes a year to build may be a worse choice than a smaller feature that ships in a month and unlocks value sooner. This is where Weighted Shortest Job First, or WSJF, becomes relevant.
WSJF is a sequencing framework built on the economics of delay. Its formula is the Cost of Delay divided by job duration. The Cost of Delay is the sum of three components: user-business value, time criticality, and risk reduction or opportunity enablement. User-business value captures the direct benefit to customers and the organization, including revenue, customer satisfaction, and strategic alignment. Time criticality measures how quickly the value decays, so a feature tied to a regulatory deadline or a seasonal window has high time criticality because delaying it past the deadline destroys most of its value. Risk reduction and opportunity enablement captures what the organization gains in reduced uncertainty or unlocked future capacity, such as an enabler that reduces technical debt. The denominator is job duration, the calendar time the value stream is occupied, rather than effort. This distinction matters: a six-person team spending two weeks on a feature represents twelve person-weeks of effort but only two weeks of duration, and duration is what governs throughput in a flow-based system.
The economics behind WSJF come from Don Reinertsen’s The Principles of Product Development Flow, published in 2009. Reinertsen’s central claim, which the Scaled Agile Framework adopted and formalized into WSJF in 2012, is that job sequencing determines throughput in a constrained system and that the optimal sequence ranks items by their Cost of Delay divided by their duration. Reinertsen put it bluntly: if you quantify only one thing, quantify the cost of delay. The framework uses a modified Fibonacci scale of 1, 2, 3, 5, 8, 13, and 20 for each input, scored relative to a reference item, so the team estimates by comparison rather than false precision. The result is a ranking that favors the work delivering the most economic value per unit of time. A customer-facing portal redesign might have a Cost of Delay of 18 and a duration of 3, giving a WSJF of 6. A compliance migration might have a higher Cost of Delay of 26 but a longer duration of 5, giving a WSJF of 5.2. The redesign ranks first because it delivers more value per unit of time, even though the migration has greater total cost of delay.
WSJF fits when delay carries measurable economic cost and multiple initiatives compete for limited capacity, the common condition of portfolio planning. RICE fits when the dominant uncertainty is user adoption rather than delay, the common condition of product roadmaps. The two are complementary. A team might use RICE to decide whether a feature is worth building at all and WSJF to decide when to build it relative to everything else.
Opportunity scoring answers a third question: where is the largest gap between what customers value and what they currently get? The framework traces to Tony Ulwick’s Outcome-Driven Innovation method, developed in the 1990s. Ulwick’s premise is that customers struggle to articulate what they want in terms of specific features but can reliably describe the outcomes they are trying to achieve. Opportunity scoring asks customers to rate the importance of a set of features or outcomes and then to rate their satisfaction with how the product delivers each one today. Features that score high in importance and low in satisfaction represent the strongest opportunities, because improving them promises a high return for the development time invested. Ulwick’s opportunity algorithm weights importance twice as heavily as satisfaction: importance plus the maximum of importance minus satisfaction and zero equals the opportunity score. On a one-to-five or one-to-ten scale, a feature rated 5 for importance and 2 for satisfaction yields an opportunity score of 8. The same survey can reveal over-investment: features rated low in importance but high in satisfaction are candidates for redeploying resources elsewhere.
Opportunity scoring differs from RICE and WSJF in a fundamental way. RICE and WSJF start from the team’s estimates of value, reach, and effort. Opportunity scoring starts with the customer’s stated priorities, making it a discovery tool as much as a prioritization tool. It tells the team where the market feels underserved, information no internal scoring exercise can generate. Its weakness is that it cannot sequence work by economics or capacity, so it pairs with RICE or WSJF rather than replacing them. A practical workflow uses opportunity scoring to find underserved areas worth investing in, then RICE to estimate the value and confidence of specific features within those areas, then WSJF to sequence the chosen features against available capacity.
No framework eliminates judgment
No framework eliminates judgment. RICE depends on honest estimates of reach, impact, and confidence, vulnerable to optimism and stakeholder pressure. WSJF depends on relative estimates of cost of delay and duration, which can be gamed by inflating value or deflating size to jump the queue. Opportunity scoring depends on survey design and on asking about outcomes rather than solutions, so poorly framed questions produce misleading gaps. These frameworks don’t remove subjectivity; they expose it. A RICE score, a WSJF ratio, or an opportunity score is a prompt for inquiry. When a surprising ranking appears, the team examines whether the inputs reflect reality, and that conversation is where the real prioritization happens. The frameworks succeed when they make trade-offs explicit, surface hidden assumptions, and replace political negotiation with shared, defensible logic. Used that way, they turn a backlog of competing demands into a roadmap a team can explain, and a stakeholder can trust.
REFERENCES
“RICE Scoring Model,” ProductPlan Glossary, https://www.productplan.com/glossary/rice-scoring-model. Referenced for the origin of RICE at Intercom, the four factors (reach, impact, confidence, effort), the RICE formula, the five-tier impact scale (3, 2, 1, 0.5, 0.25), the confidence percentages (100, 80, 50), and effort measured in person-months.
Morné Wiggins, “WSJF in SAFe: Prioritize by Economic Value,” Agility at Scale, https://agility-at-scale.com/safe/lpm/wsjf-weighted-shortest-job-first. Referenced for the WSJF formula (Cost of Delay divided by Job Duration), the three Cost of Delay components (user-business value, time criticality, risk reduction or opportunity enablement), the attribution to Don Reinertsen’s The Principles of Product Development Flow (2009) and Dean Leffingwell’s formalization into SAFe in 2012, Reinertsen’s quote on quantifying the cost of delay, the modified Fibonacci scale, the distinction between duration and effort, and the worked example of the portal redesign versus the compliance migration.
Reinertsen, Donald G. The Principles of Product Development Flow: Second Generation Lean Product Development. Celeritas Publishing, 2009. Referenced as the source of the cost-of-delay economics that underpin WSJF.
“Opportunity Scoring,” ProductPlan Glossary, https://www.productplan.com/glossary/opportunity-scoring. Referenced for the framework’s origin in Tony Ulwick’s Outcome-Driven Innovation method from the 1990s, the importance-versus-satisfaction analysis, the opportunity algorithm (importance plus the maximum of importance minus satisfaction and zero), the twice-weighted importance, and the use of one-to-five or one-to-ten scales.
Ulwick, Anthony W. “Outcome-Driven Innovation.” Referenced as the origin of the opportunity scoring algorithm and the premise that customers can describe desired outcomes more reliably than specific features.