
Quantitative product analytics turns product behavior into evidence and should not be confused with setting up dashboards and blindly following metrics. Modern technical product managers need to understand funnels, cohorts, and experiments well enough to challenge misleading numbers and choose the right level of proof for the decision at hand. The point is to measure the few behaviors that reveal if the product is creating value and which changes are likely to improve outcomes without creating new damage.
A funnel is useful because it shows how users move through a sequence of intended behaviors. In a SaaS onboarding flow, that might mean account creation, workspace setup, an invite sent, the first integration connected, the first report viewed, and the first recurring use. In a marketplace, it might mean search, listing view, message, booking, payment, and repeat purchase. The power of funnel analysis is that it makes friction visible. The danger is that it can make the product team obsess over conversion steps without understanding why users behave as they do. A drop-off is not automatically a product problem. It may reflect poor targeting, unclear messaging, a lack of trust, technical latency, a price shock, organizational approval, or a simple lack of urgency.
Cohort analysis adds a time and segment lens that aggregate metrics often hide. Cohorts are especially important because product changes rarely affect all users equally. A feature that helps power users may confuse new users. A recommendation system may improve engagement for frequent users while doing little for cold-start users. A mobile redesign may raise activation in one region and reduce task completion in another. Averages can hide these differences until the business has already scaled to the wrong conclusion. PMs can use cohort analysis to dig deeper into questions such as whether new users are retaining better than older users, or whether a pricing change improved revenue while reducing long-term engagement.
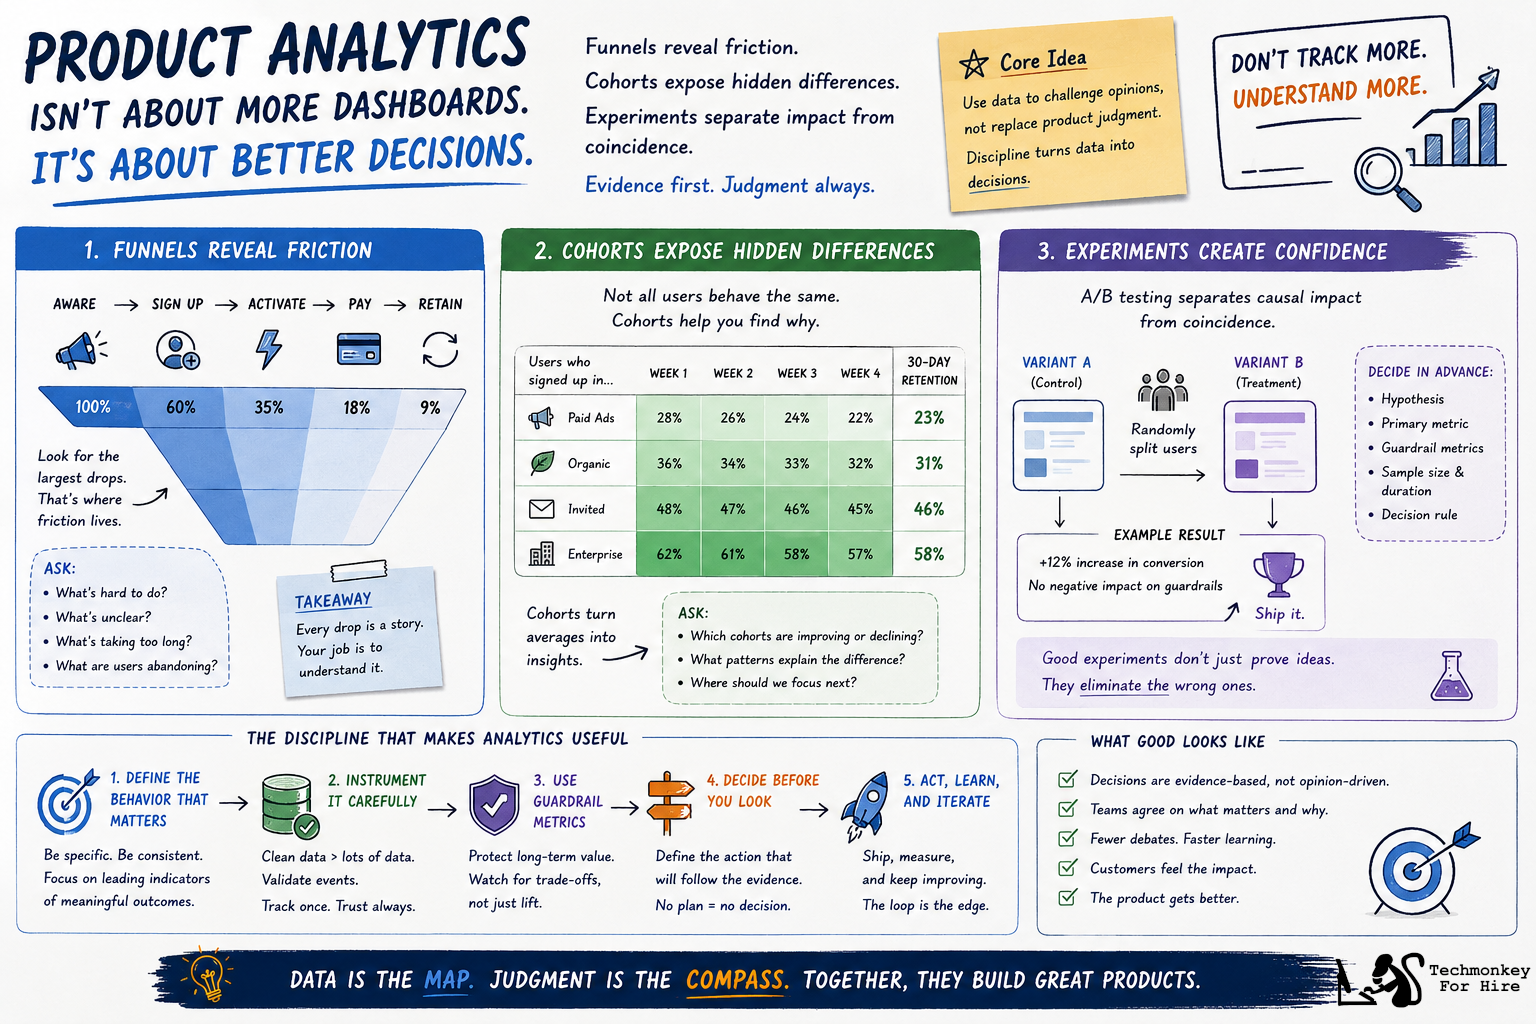
A/B testing gives product teams a way to estimate causal impact rather than merely observe correlation. A/B testing should be a controlled experiment in which users are randomly assigned to a control experience or a treatment experience. Then the PM compares outcomes across those groups to help eliminate variables introduced by confounding factors, such as a new feature that may launch during a marketing campaign or a pricing page change while sales incentives shift. Randomized experiments do not make judgment unnecessary, but they reduce the chance that the team mistakes timing, selection, or external noise for product impact.
Good experiments begin with a clear hypothesis. For instance, “improve onboarding” is not a hypothesis. A clear hypothesis should contain a named behavior, a mechanism, and a measurable outcome. An example is, “If we ask users to connect their data source before inviting teammates, more workspaces will reach their first useful report within seven days.” The PM should also define guardrails and negative metrics before the test begins. For instance, a checkout experiment may increase conversion while increasing refunds, or a notification experiment may increase daily active use while increasing unsubscribes.
Sample size and duration matter more than many roadmap conversations admit, because ending a test early, because the chart looks promising, can create false confidence. Additionally, looking at too many segments can turn noise into a story. Experimentation experts such as Ron Kohavi have written extensively about the discipline required for trustworthy controlled experiments, including metric design, randomization quality, statistical power, and the many ways teams can fool themselves with apparently precise results.
For PMs, the practical takeaway is simple: do not treat an experiment result as trustworthy until the setup is trustworthy. Quantitative analysis works best when paired with qualitative learning. Analytics tells the team where to look and how large a pattern might be. Research helps explain the mechanism behind the pattern.
For technical PMs, the most valuable analytics practice is to connect metrics to decisions. Before building a dashboard, ask what decision it will inform. Before running an experiment, ask what action will follow if the result is positive, negative, or inconclusive. Before presenting a metric to executives, explain its definition, its limitations, and its relationship to customer and business outcomes.
The modern product organization needs a rigorous measurement culture. Data should challenge opinions and experiments should improve confidence. Funnels and cohorts should reveal patterns, not reduce customers to spreadsheet rows. The best PMs use quantitative product analytics as a learning system. They define meaningful behaviors, instrument them carefully, compare users in context, test changes responsibly, and combine statistical evidence with customer understanding. Analytics becomes a practical way to make better product decisions under uncertainty, and more than just reporting.
REFERENCES
Ron Kohavi, Diane Tang, and Ya Xu, Trustworthy Online Controlled Experiments: A Practical Guide to A/B Testing. Cambridge University Press. https://www.cambridge.org/core/books/trustworthy-online-controlled-experiments/D97B26382EB0EB2DC2019A7A7B518F59
Microsoft ExP Platform, Accelerating Innovation through Trustworthy Experimentation. https://exp-platform.com
Ron Kohavi, Online Experimentation at Microsoft. Stanford-hosted public PDF. https://robotics.stanford.edu/~ronnyk/ExPThinkWeek2009Public.pdf
Google Research, Measuring the User Experience on a Large Scale: User-Centered Metrics for Web Applications. https://research.google.com/pubs/archive/36299.pdf
Statsig, Cohort-based A/B tests. https://www.statsig.com/perspectives/cohort-ab-tests