
Every technology product competes for attention, budget, and adoption, even when it looks like the first of its kind. Buyers always have alternatives. They can choose a rival tool, keep using a spreadsheet, build something internally, or do nothing at all. Market and competitive analysis is how a product team understands the landscape and turns it into sharper decisions about what to build, how to price it, and why it matters. Teams that skip this work tend to build in a vacuum, ship features nobody uses, and struggle to articulate why anyone should switch.
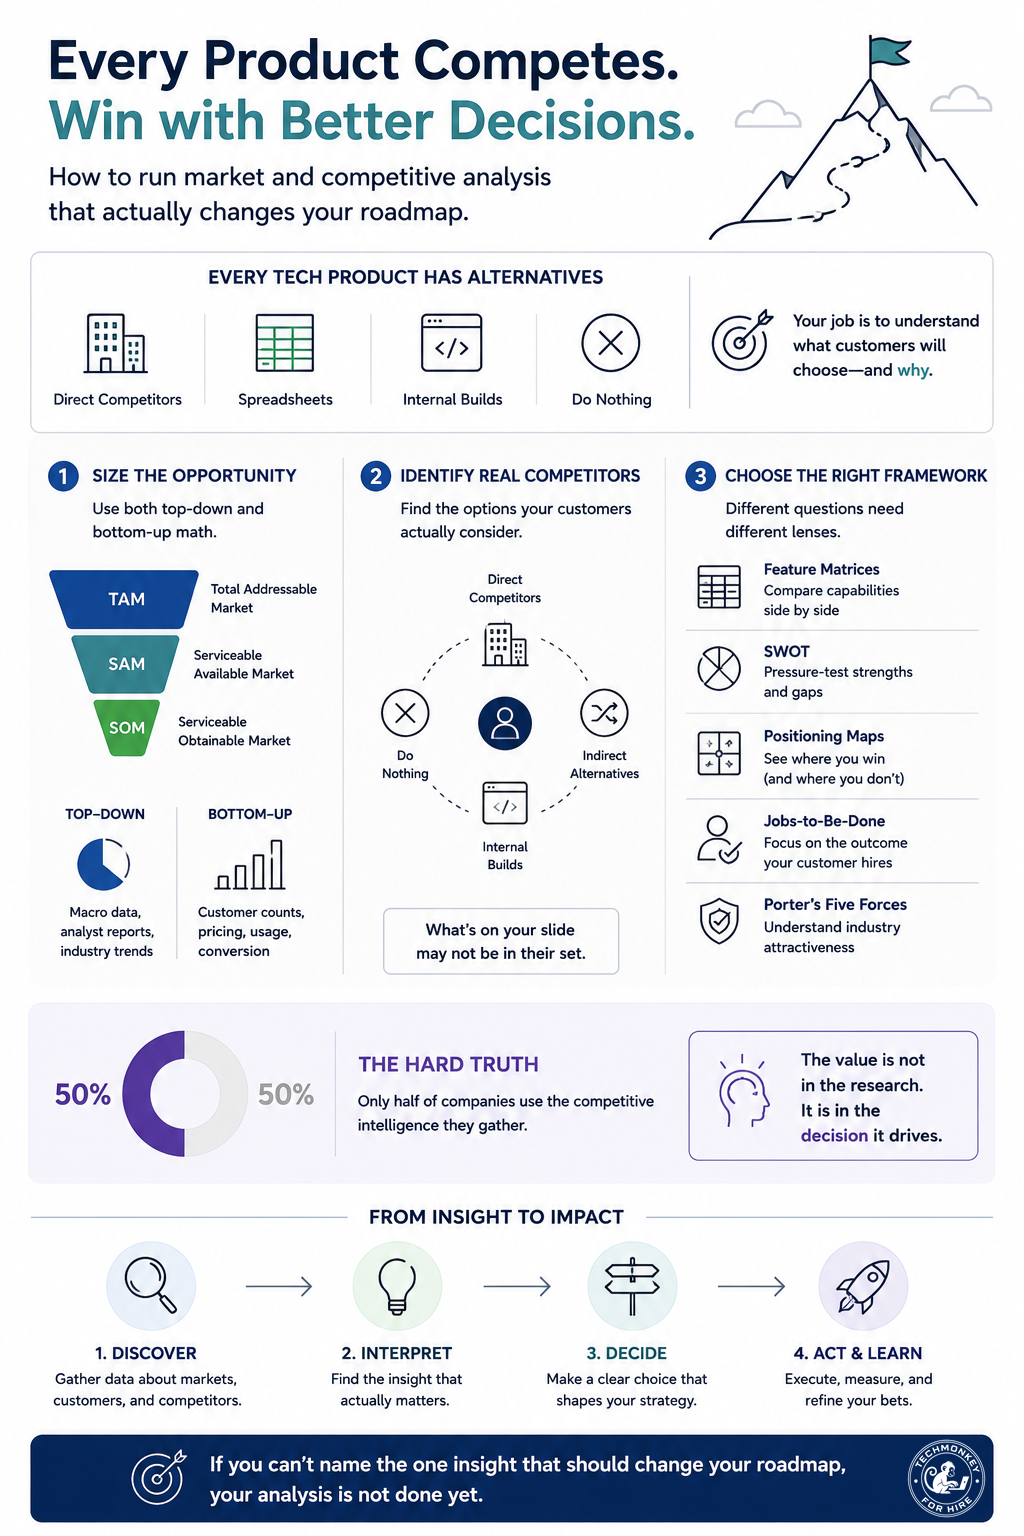
Market analysis starts with sizing the opportunity honestly. The common framework for this is TAM, SAM, and SOM. TAM, the total addressable market, is the full revenue opportunity if a product captured every possible customer for its category. SAM, the serviceable available market, narrows that number to the segment a company can realistically serve given its geography, product fit, and capacity. SOM, the serviceable obtainable market, is the slice of SAM a company can actually win within a defined timeframe based on its resources, pricing, and competitive position. A useful illustration comes from Salesforce: a SaaS company selling to manufacturers might estimate 600,000 businesses at $10,000 each for a $6 billion TAM, then narrow to 200,000 businesses that fit its profile for a $2 billion SAM, and finally project 1,000 new customers per year for a $10 million SOM.
There are two ways to reach these numbers. The top-down approach relies on industry reports and analyst data, then narrows to a realistic share. It works well for brand-new products when a team has little sales data, and it is fast, but it is only as accurate as the underlying reports. The bottom-up approach starts from real sales data and customer economics, then scales upward. It takes more time but tends to be far more credible, especially with investors who have seen inflated market claims before. Strong teams calculate both and reconcile the gap, because a wide divergence usually signals a flawed assumption worth examining.
Market sizing tells a team whether an opportunity is worth pursuing. Competitive analysis tells a team whether it can win. The first step is defining the goal and scope. A team preparing a launch needs a different depth of study than a team refining its messaging. Setting the trigger up front, whether it is a launch, unexplained churn, weakening positioning, or entry into a new region, keeps the work focused on the choices it needs to inform.
The next step is identifying the real competitors, which are often different from the names a marketing team lists. The clearest signal comes from customers. When a user says they evaluated two rivals and chose this product because the interface felt faster, that single sentence reveals who the real competition is, what the user values, and which pain points they wanted to avoid. Direct competitors are obvious, but indirect competitors such as spreadsheets, internal scripts, and manual workarounds matter just as much. This is because often your biggest competition is the ingrained behavior your product is trying to replace. Support tickets, sales conversations, and review sites such as G2 and Capterra surface these alternatives quickly. A working list of five to seven competitors across these categories is usually enough.
With the field defined, brushing the dust off your MBA classwork and creating a framework brings order to the comparison. A feature comparison matrix shows where a product leads, lags, or matches rivals, helping prioritize the roadmap. A SWOT analysis assesses each competitor’s strengths, weaknesses, opportunities, and threats, which is well-suited to positioning and strategy questions. A positioning map plots players on two dimensions that customers care about, such as price against ease of use, and reveals open space a product might claim. A jobs-to-be-done comparison focuses on the outcomes customers are trying to achieve, which keeps a team from chasing feature parity for its own sake. Porter’s Five Forces offers a broader lens by examining competitive rivalry, the threat of new entrants, the threat of substitutes, and the bargaining power of buyers and suppliers, which is useful for understanding a market’s structural attractiveness before committing to it.
Good analysis draws from many sources rather than just competitor homepages. Pricing and packaging pages reveal what a rival believes customers value and where it puts its paywall. Free trials and demos show the onboarding experience a product is measured against. Customer reviews expose recurring praise and complaints, and the exact language buyers use signals how they perceive value. Job postings hint at strategic direction, since a competitor hiring aggressively in one area is usually investing in that area. The goal is enough context to support clear decisions, not an academic report.
The most valuable layer of competitive analysis is perception. In crowded markets where feature sets converge, how customers feel about the alternatives often decides the outcome. The words users repeat, whether they call a rival clunky or refreshing, act as shorthand for deeper sentiment. Understanding why customers switch or stay, and what frustrates or delights them, moves a team from surface-level comparisons to a real understanding of where a product sits in the buyer’s mind.
Analysis only pays off when it becomes action. The final step is translating findings into product decisions: closing feature gaps that keep customers from switching, cutting overbuilt areas, differentiating in onboarding or performance, adjusting pricing to match the value delivered, and repositioning when the market shifts. Research from Harvard Business Review found that only half of companies actually use the competitive intelligence they collect, which is why insights must connect directly to the roadmap, the messaging, and the go-to-market plan.
Market and competitive analysis is not a once-a-year exercise. Markets move, rivals ship, and buyer expectations rise. The strongest technology teams treat this work as a living habit, revisiting their market sizing and competitive picture each quarter and tying it back to customer interviews and churn data. As an exercise to the reader, pick one active roadmap decision, size its opportunity with both a top-down and bottom-up estimate, map the five to seven alternatives customers actually consider, and write down the single insight that should change what the team does next. If that insight is hard to name, the analysis is not finished.
REFERENCES
Caylin White, Salesforce, TAM, SAM, and SOM: Made Simple for Growing Businesses. https://www.salesforce.com/blog/small-business/tam-sam-som
Carlos Gonzalez de Villaumbrosia, Product School, Product Manager’s Power Move: Competitor Analysis. https://productschool.com/blog/skills/product-manager-competitive-analysis
Harvard Business Review, Only Half of Companies Actually Use the Competitive Intelligence They Collect. https://hbr.org/2016/01/only-half-of-companies-actually-use-the-competitive-intelligence-they-collect
Arise GTM, Porter’s Five Forces. https://arisegtm.com/blog/porters-five-forces
Productfolio, Competitive Analysis Frameworks. https://productfolio.com/competitive-analysis-framework